[[wikilinks]] between related content. Point Obsidian at the memory directory and you get a live knowledge graph that grows with every take_notes call.
Obsidian Setup for Mac
Set Obsidian as the default opener for
.md and .txt files on macOS.What you get
- YAML frontmatter on every file: title, tags, duration, language, date, type
- Automatic tagging: semantic embeddings assign topic tags without any manual work
[[Wikilinks]]between semantically related transcriptions- MOC (Map of Content) hub files that cluster transcriptions by topic
- Notes ↔ transcription links: every notes file links back to its source
- No orphan nodes: chronological neighbor links ensure every file is connected
File types
| Type | Description | Created by |
|---|---|---|
transcription | Raw timestamped transcription from audio | transcribe_audio |
notes | Formatted notes with headers and structure | take_notes |
translation | English translation of non-English audio | transcribe_audio with translated_text |
moc | Map of Content hub linking all files under a tag | rebuild_graph |
How connections form
- Tags create shared hub nodes. Two files tagged
#AIboth connect to the AI node [[Wikilinks]]connect semantically similar transcriptions via embedding cosine similarity- MOC files act as cluster centers, pulling related nodes together
- Notes link back to their source transcription via
source_transcriptionfrontmatter - Translations link back to the original via
originalfrontmatter - Chronological neighbors: every new transcription links to the previous one, preventing orphans
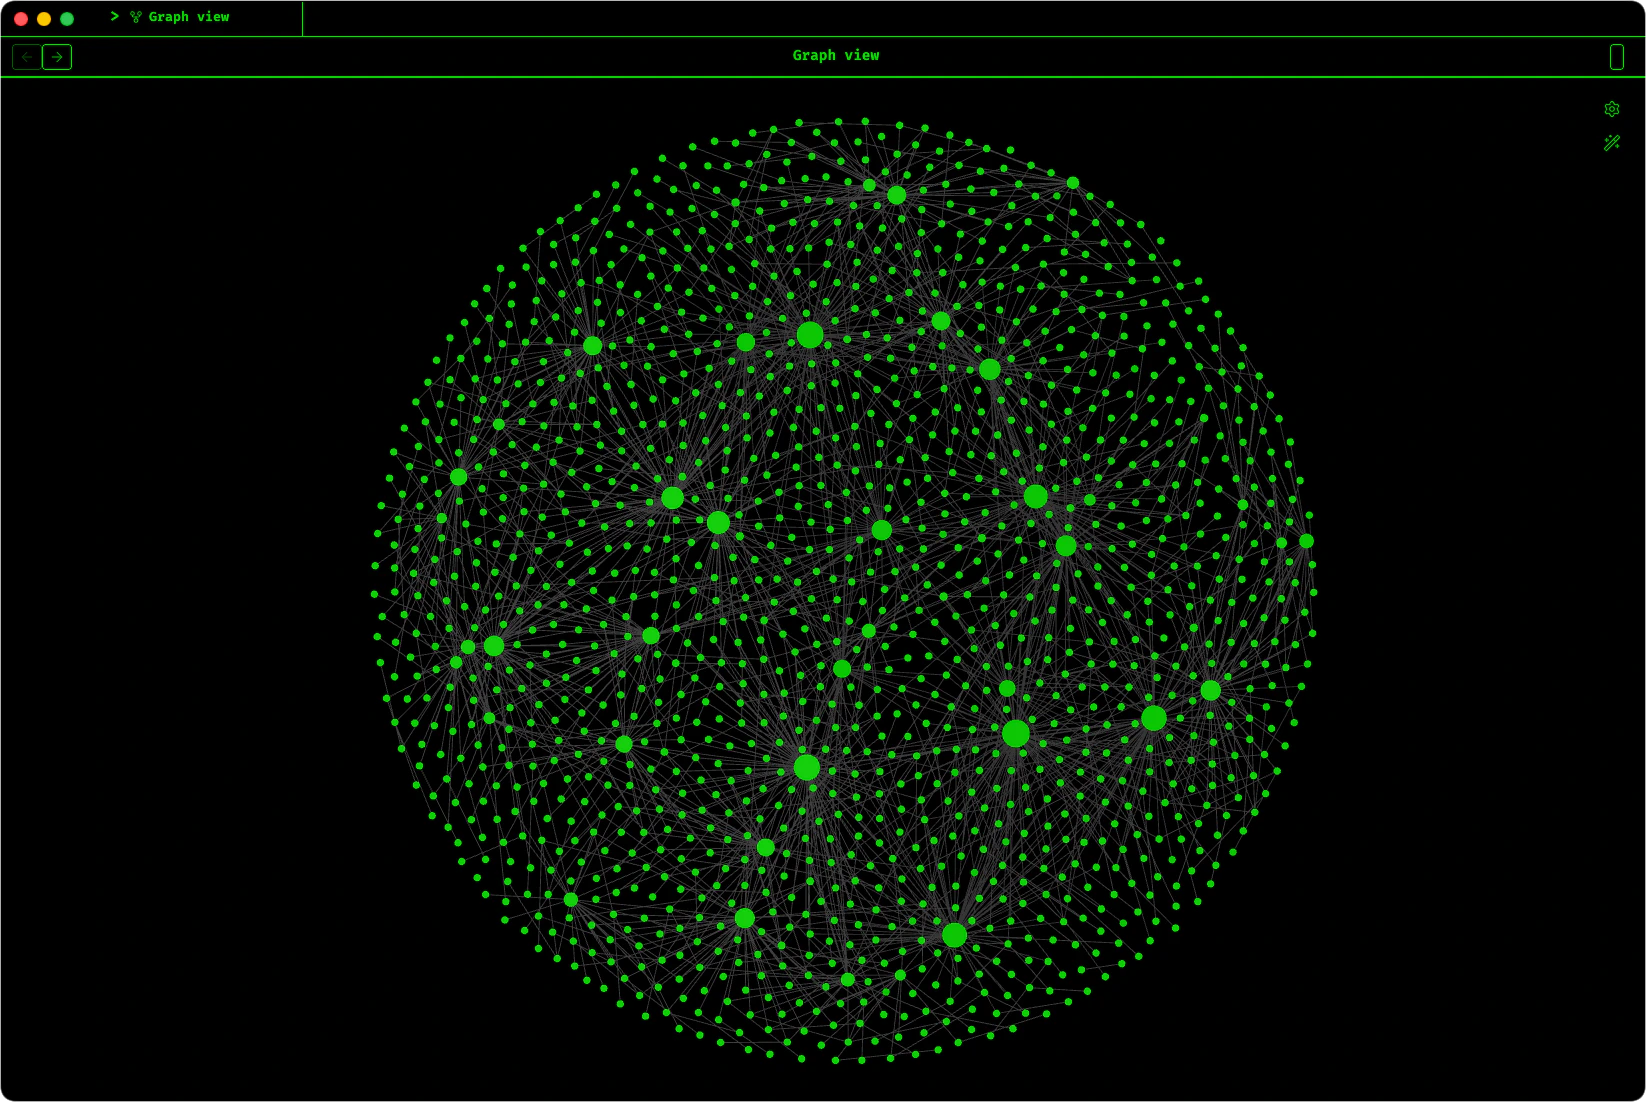
Graph view
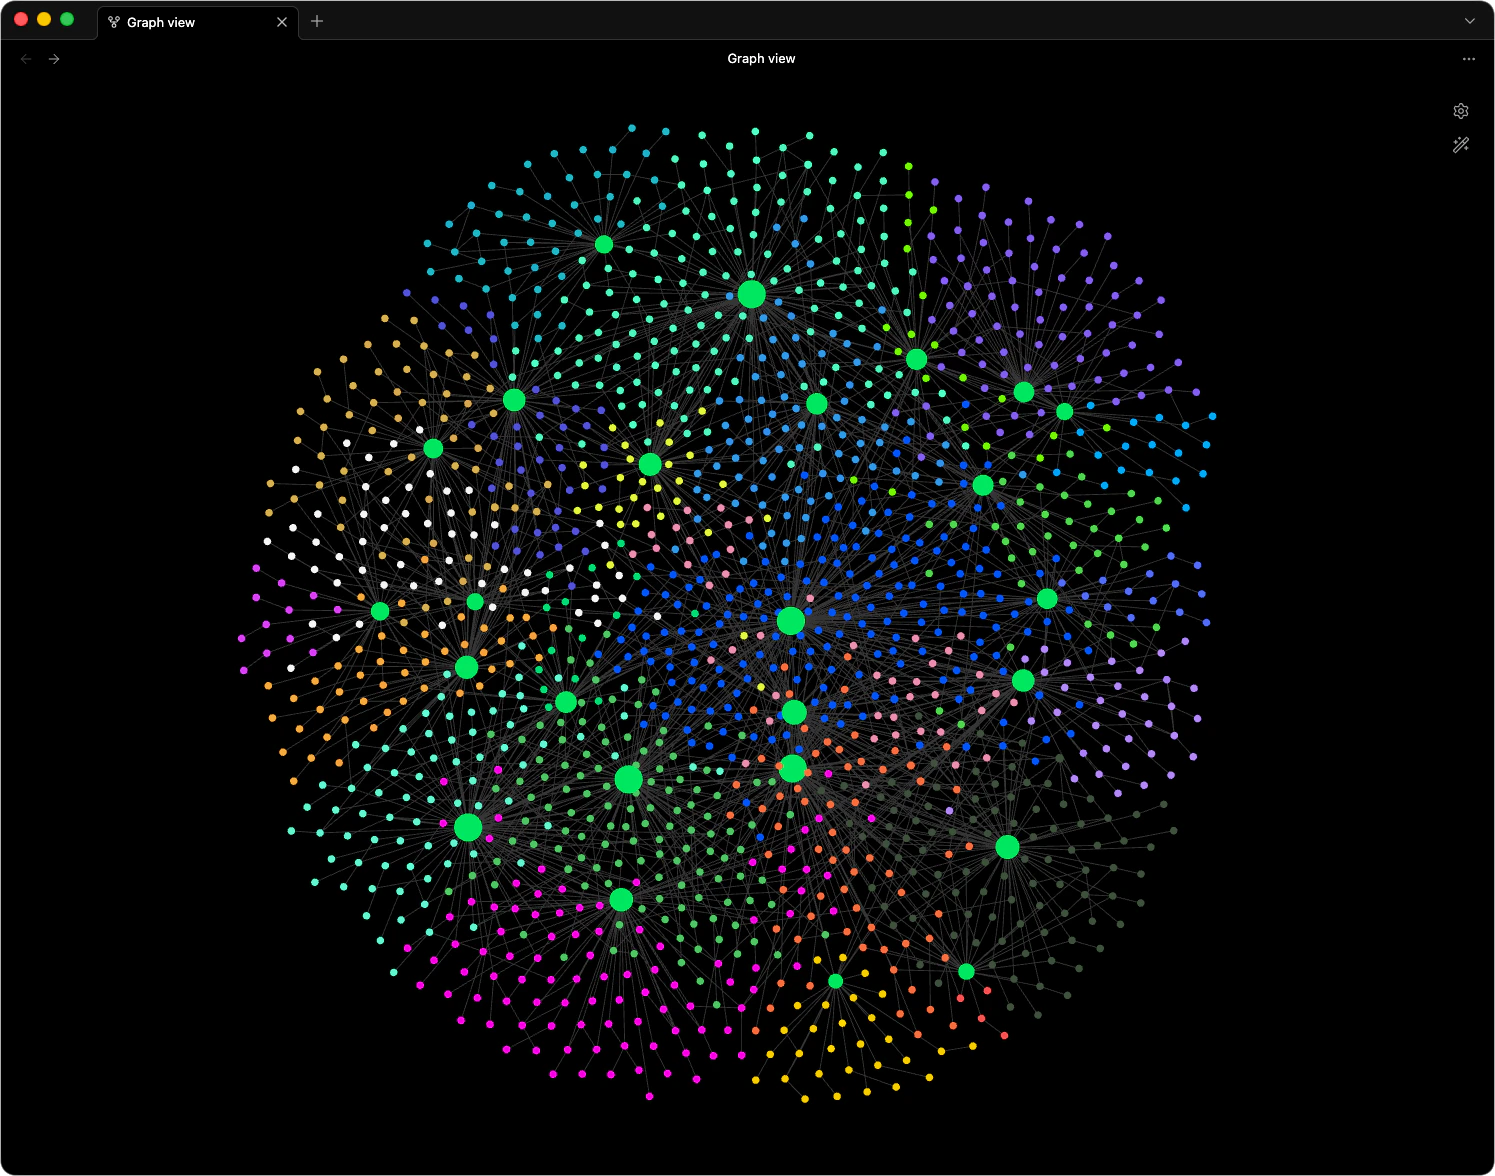
Color groups
Open Graph view > Settings (the gear icon) and add color groups to visually distinguish topics. These are examples to get you started — replace them with your own tags and colors:| Query | Color | Hex |
|---|---|---|
path:MOC | Augent Green | #00F060 |
tag:#AI | Orange | #FF6D00 |
tag:#Science | Blue | #448AFF |
tag:#Cooking | Green | #69F0AE |
tag:#Programming | Purple | #7C4DFF |
tag:#Music | Light Grey | #E0E0E0 |
tag:#Fitness | Red | #FF1744 |
tag:#DIY | Electric Blue | #0055FF |
tag:#Gaming | Cyan | #18FFFF |
tag:#Art | Amber | #FFD740 |
tag:#Math | Teal | #1DE9B6 |
tag:#Design | Pink | #FF4081 |
Display settings
These values are a good starting point. Tweak them to your preference.| Setting | Value | Why |
|---|---|---|
| Centre force | 0.50 | Controls the circular appearance of the graph |
| Repel force | 0.00 | Keeps correlated nodes clustered together |
| Link force | 1.00 | Makes nodes visually appealing and well-connected |
| Link distance | 30 | Plenty of spacing without spreading things too far |
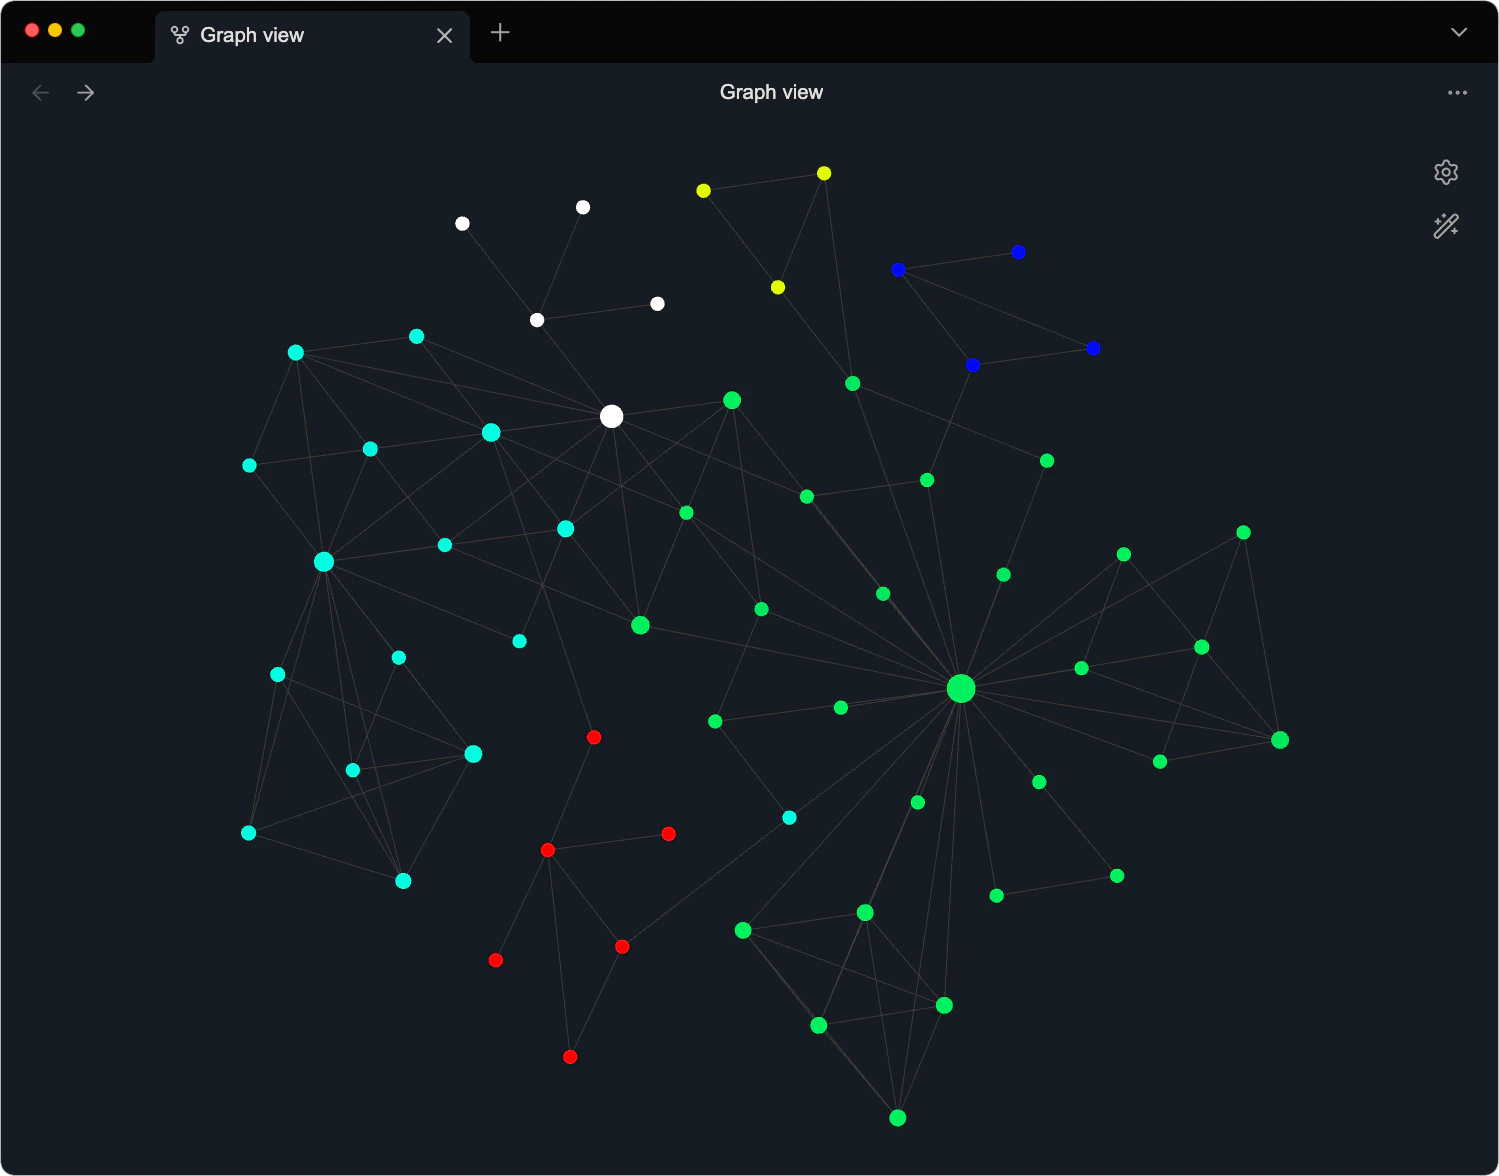
Local graph vs global graph
- Global graph (
Cmd + G): Every file in the vault. Great for the full picture, but gets dense past a few hundred files. - Local graph: Right-click any file > Open local graph. Shows only that file’s immediate connections.
Filtering
In the graph filter section, typetag:#AI to show only AI-tagged files and their connections. Combine with -path:MOC to hide hub files and see direct file-to-file links.